
Hong Kong through the Looking Glass: A Series on Sustainable Planet, People, and Prosperity
Recent photos from the mainland China city of Harbin show visibility reduced to 10 meters because of air pollution. The airport and schools had to be closed. The images make Mordor look good and Hong Kong air seem almost pristine by comparison. The vice director of China’s Environmental Protection Agency stated “The heavy pollution of Harbin is due to weather conditions”.
 The San Gabriel Mountains often were invisible when I lived in Los Angeles in the late 80’s. “That’s not necessarily pollution,” a California friend told me. “Sometimes it’s ocean fog and humidity.” Hmmm. She came from San Francisco and it might be true for that city. But for most parts of greater LA like Ontario in the eastern half of the megalopolis, 45 miles (72 km) from the ocean and only 4 miles (6.5 km) from the mountains, it’s hard to believe that fog was the culprit when the range couldn’t be seen. I’ve read and hope that the air in LA is better now.
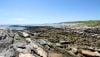
Before coming to Hong Kong I’d heard that its air quality is poor. Nevertheless when I arrived and had trouble seeing the wind turbine on Lamma or even the island itself 3 km (2 miles) away from our apartment windows I gave air quality the benefit of the doubt. The 80 percent humidity typical at that time of year was definitely higher than Tucson’s usual 35 percent. That coupled with ocean effects (which keep Hong Kong’s day and night temperatures within about a 5°C (9°F) range) could create atmospheric conditions leading to decreased visibility.
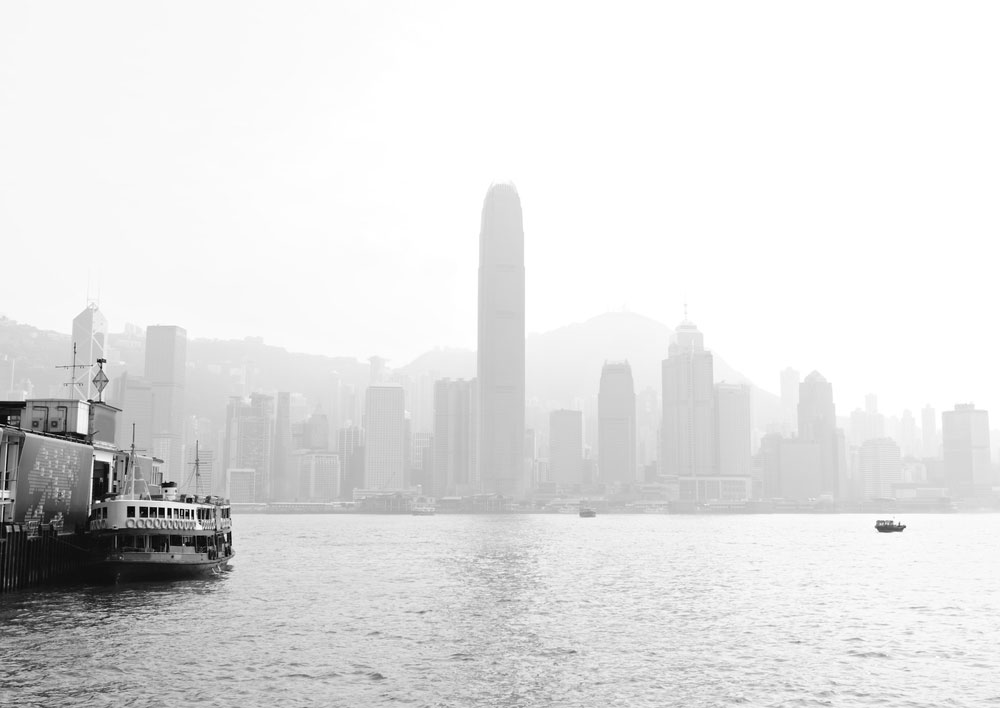
But now I’ve been here almost two months and autumn has begun. Humidity has noticeably decreased. Our dehumidifier water storage tank is taking far longer to fill and the relative humidity was only 42 percent this morning. But still the air isn’t clear by Tucson standards and I can’t remember even part of a day when it has been. Tucson’s air visibility is very good and by that measure Hong Kong can’t help but fall short.
 To give some perspective, Reuters reports that during its recent pollution spike Harbin’s air pollution reading for PM2.5 (fine suspended particles) was around 1,000 and last winter Beijing’s peaked at greater than 900. Hong Kong’s, Los Angeles’s, and Tucson’s 2012 24-hour average maximums were 210, 58.7, and 27.7 respectively.
On the other hand with respect to monitoring, informing the public about, and making efforts to improve air quality there things Tucson can learn from Hong Kong. The Hong Kong government publishes data from 14 monitoring sites which each report five to six categories of air pollutants hourly on the web in near real time and it has done this for a number of years. This becomes more impressive in the context of China’s nondisclosure of detailed air pollution data prior to 2012. Tucson’s monitoring is far less for approximately the same metropolitan land area. Tucson (Pima County) collects a full spectrum of pollution data at only one site. And although it has 13 additional sites only two measure more than one or two pollutants.
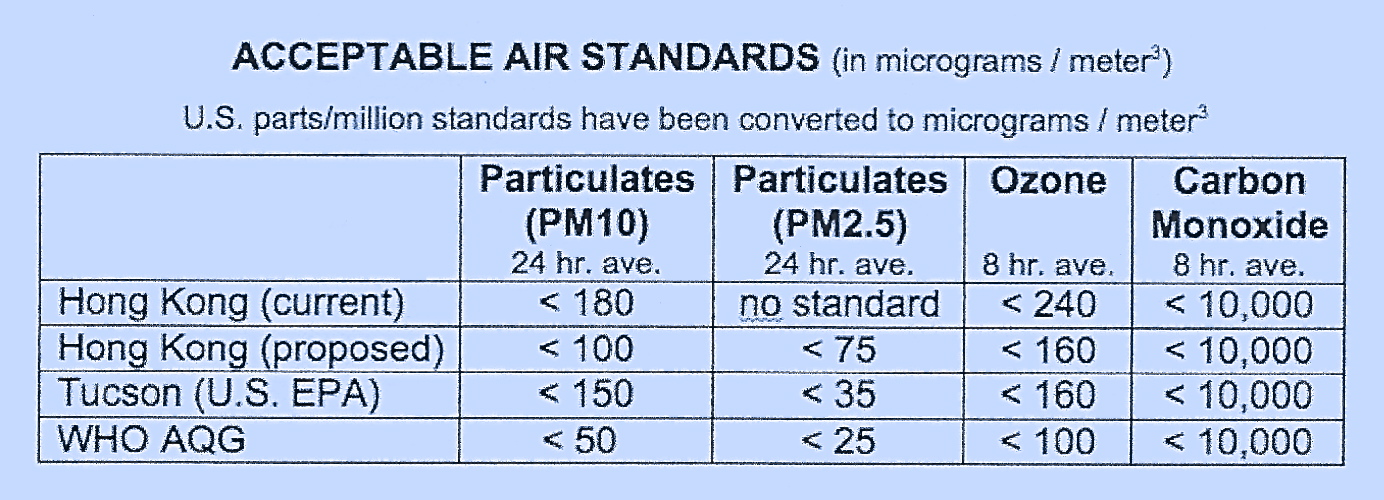
However what Hong Kong considers as acceptable air is more polluted than what is considered acceptable by Tucson, which follows U.S. EPA standards. New HK Air Quality Objectives proposed for adoption in 2014 will improve that. But neither Hong Kong’s proposed standards nor Tucson’s meet World Health Organization (WHO) Air Quality Guidelines. Here’s a comparison.
Although its air quality objectives are less healthy than Tucson’s, Hong Kong has significantly improved its air over the past 15 years. Following comprehensive vehicle emission control measures announced in 1999, levels of particulates, sulfur dioxide, and nitrogen oxides decreased 34 percent, 60 percent, and 30 percent respectively by 2010. In the past few years a variety of carrot and stick measures have been adopted to further decrease vehicle emissions. These include grants to encourage owners of older cars to replace them with less polluting vehicles and a law requiring drivers to turn off engines while vehicles are stationary.
 Additional measures planned for implementation include expansion of Hong Kong’s heavily used rail network (I’m eagerly awaiting the already-under-construction MTR extension to the University of Hong Kong and Kennedy Town), rationalization of bus routes, the establishment of zones limited to pedestrians or low emission vehicles, and the adoption of mandatory building energy codes.
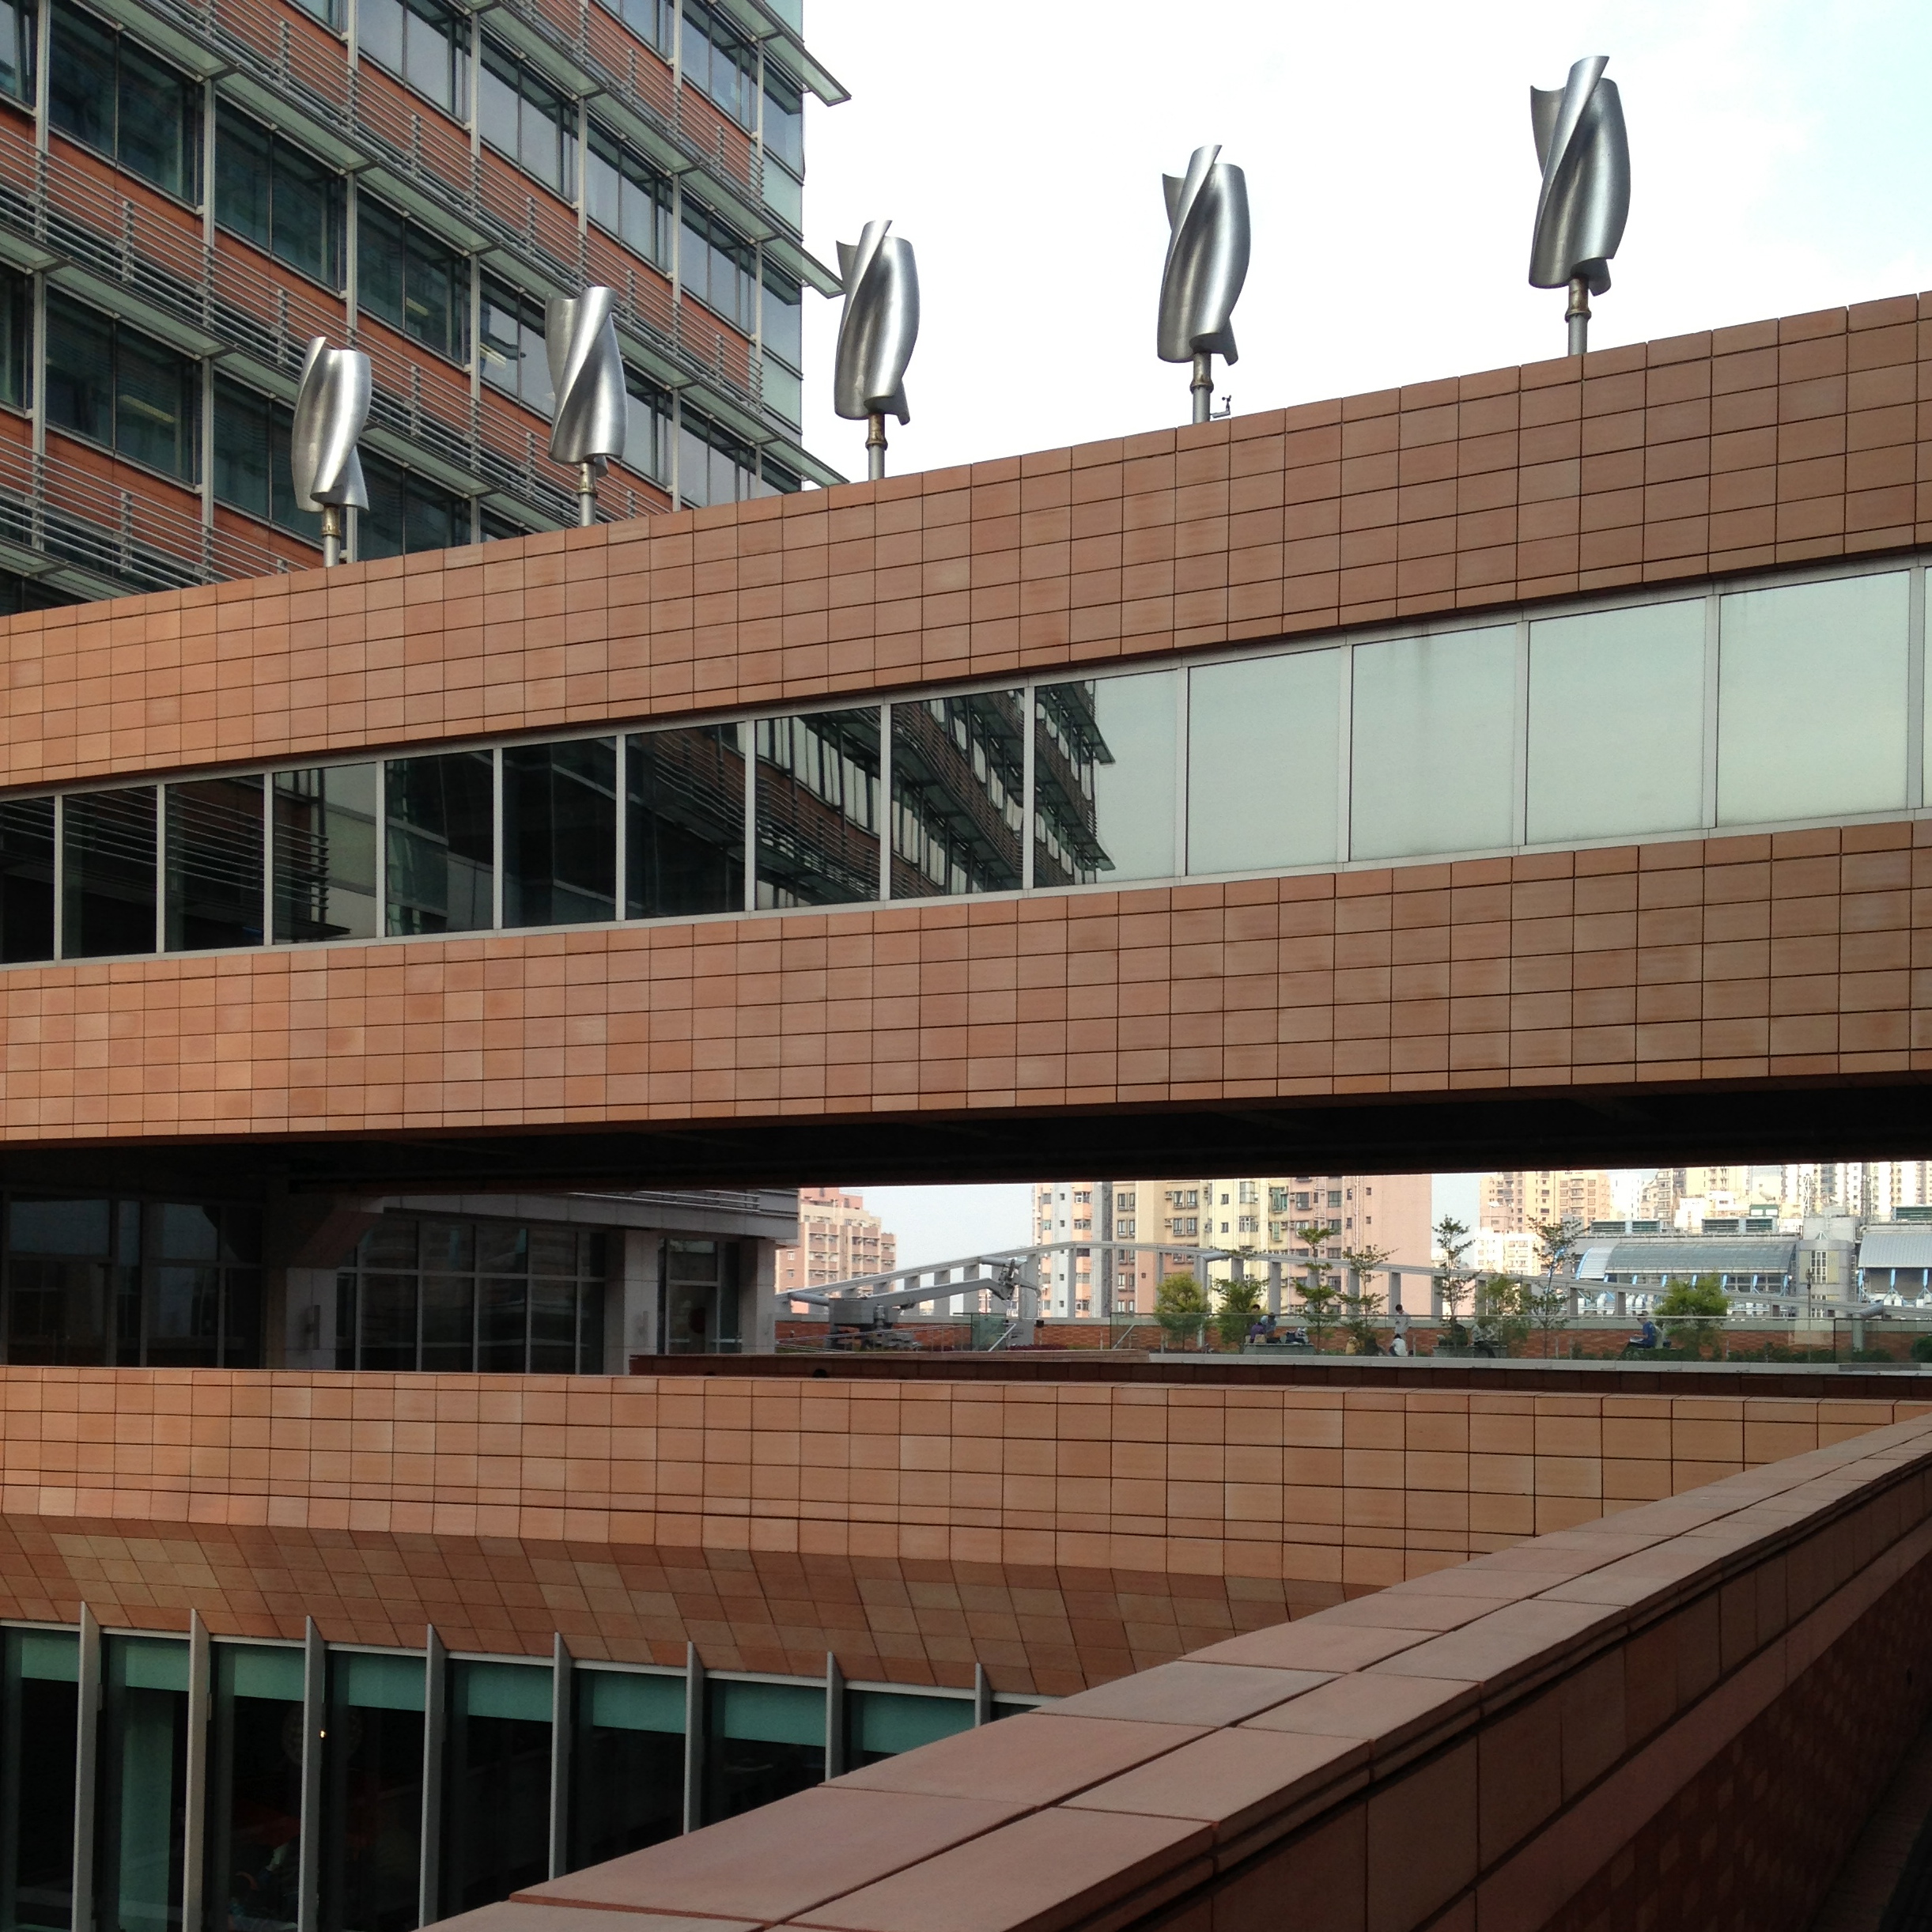
Electricity generation is the largest single source of pollution in Hong Kong. To encourage HK’s two government regulated privately-owned coal-dependent power companies to invest in renewable energy, a higher profit is allowed on such investment and the companies’ overall rate of return is linked to performance in meeting emission caps. Unfortunately non-utility solar photovoltaic systems seem to be almost, but not quite, nonexistent here and there appears to be little interest in them. I’m working on figuring out the reason for that.
Side Notes: PM 2.5 are particles suspended in air that are less than 2.5 microns in diameter. They are caused by combustion from sources such as vehicles, ships, power plants, and trash incineration and are harmful to health.
After deducting parkland, which is 40 percent of Hong Kong’s total land area, the remaining metropolitan area of about 255 (660 km2) square miles is essentially the same as the City of Tucson’s 227 square miles (588 km2) and far less than Pima County’s 9,189 square miles (23,799 km2).
In addition to pollution data the Air portion of the Hong Kong Environmental Protection Department website contains a wealth of information about current and proposed air quality policies, objectives, and strategies. Information about HK’s past air quality improvement is from this site.
Smog in Hong Kong photo in header courtesy Shutterstock. All other photos by Dante Archangeli.